Just when you think finance is becoming dull and tedious, it always manages to surprise. Recently, it seems everyone is reshaping the financial system in ways few foresaw, including those from the entertainment and media industries.
Take Jimmy Donaldson (known as "MrBeast" on YouTube) as an example. He not only has a snack empire but recently also acquired a banking app aimed at promoting financial literacy and money management among teenagers and young adults. Why? Perhaps nothing is more straightforward than monetizing a subscriber base of 466 million users with financial products.
This summer, the world's largest derivatives exchange, CME Group, will launch single-stock futures, allowing users to trade futures on over 50 top U.S. stocks, including Alphabet, NVIDIA, Tesla, and Meta.
These restructurings show us how people's ways of engaging with finance are changing. And nothing illustrates this better than the explosion of the Perpetual Markets over the past few years.
Perpetual futures (or Perps) are a type of financial derivative contract that allows market participants to speculate on asset prices without an expiration date. Perps also enable people to express views on assets quickly and cheaply. They are more captivating than traditional markets because they offer instant access and leverage. Unlike traditional markets, they don't require broker onboarding processes, jurisdictional paperwork, or adherence to "traditional" market hours.
Furthermore, on-chain perpetual markets allow any asset (whether traditional or crypto) to be traded in a permissionless, highly leveraged manner. This makes speculation fun, especially when humans can't resist gambling on the trajectory of volatile assets outside traditional trading hours. This enables risk to be priced in real-time.
Consider what happened two weeks ago. When traditional and crypto markets crashed simultaneously, traders flocked to Hyperliquid, driving perpetual gold and silver trading into a frenzy. On January 31st, Hyperliquid alone accounted for 2% of the global daily trading volume in its silver (Silver) perpetual contract market, which had been live for less than a month.
This explains why dashboards of perpetual contract trading volume are increasingly dominating crypto communities and forums. Trading volume is an absolute value. It looks large, refreshes every few minutes, and is perfect for leaderboards. But it misses a key nuance: volume may reflect movement that lacks meaning. A market with high volume might have depth, but it could also be due to rewards and incentives encouraging higher-frequency activity. This activity is often recursive and not very meaningful.
This week, I delved into other metrics of the perpetual trading market. When used in conjunction with trading volume, these metrics add more dimensions and tell a completely different story from volume alone.
Let's begin.
A Few Data Points
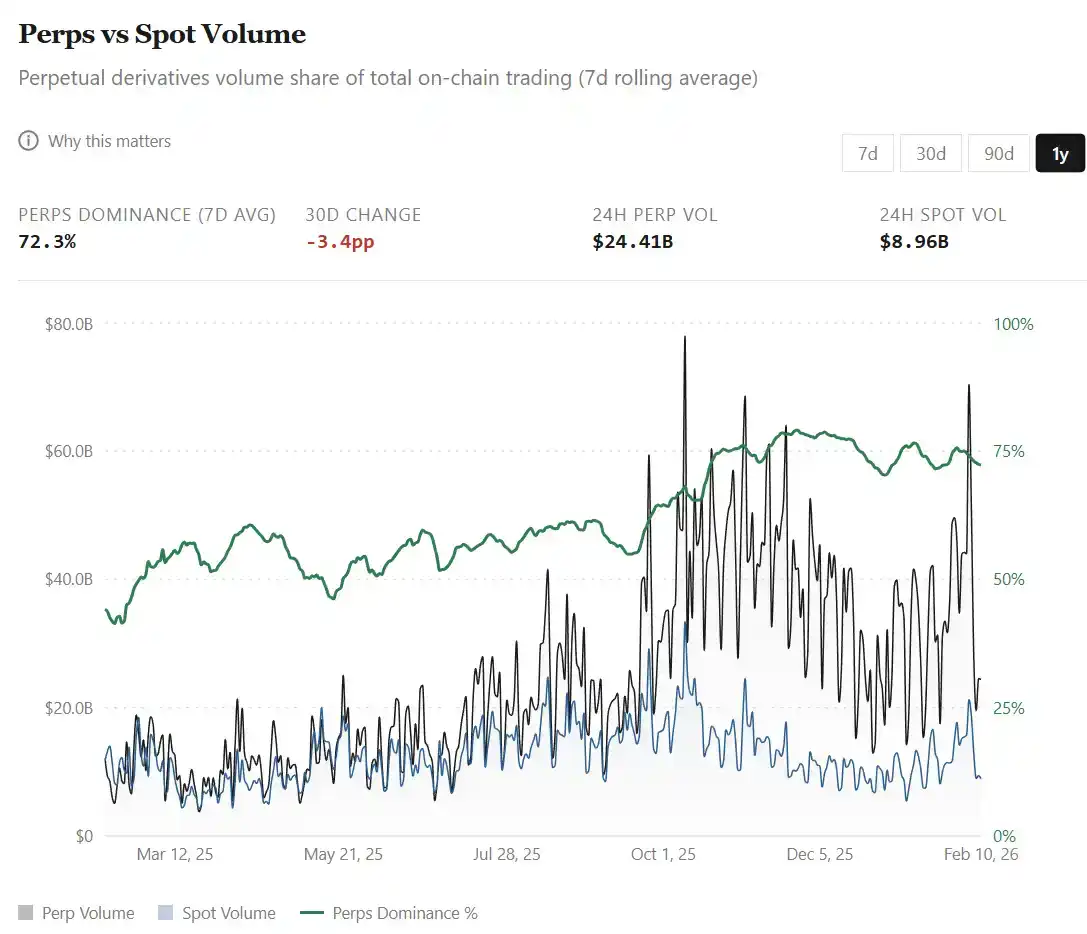
The user-friendly interface of perpetual markets makes them a low-barrier, default platform for expressing views across various markets and global assets. The wide selection of highly leveraged derivative trading on both traditional and crypto assets on a single platform has led to perpetual contract volume surpassing spot trading volume on decentralized exchanges. From 44% in February 2025, the share of perpetual contract volume has soared to about 75% today (relative to spot volume).
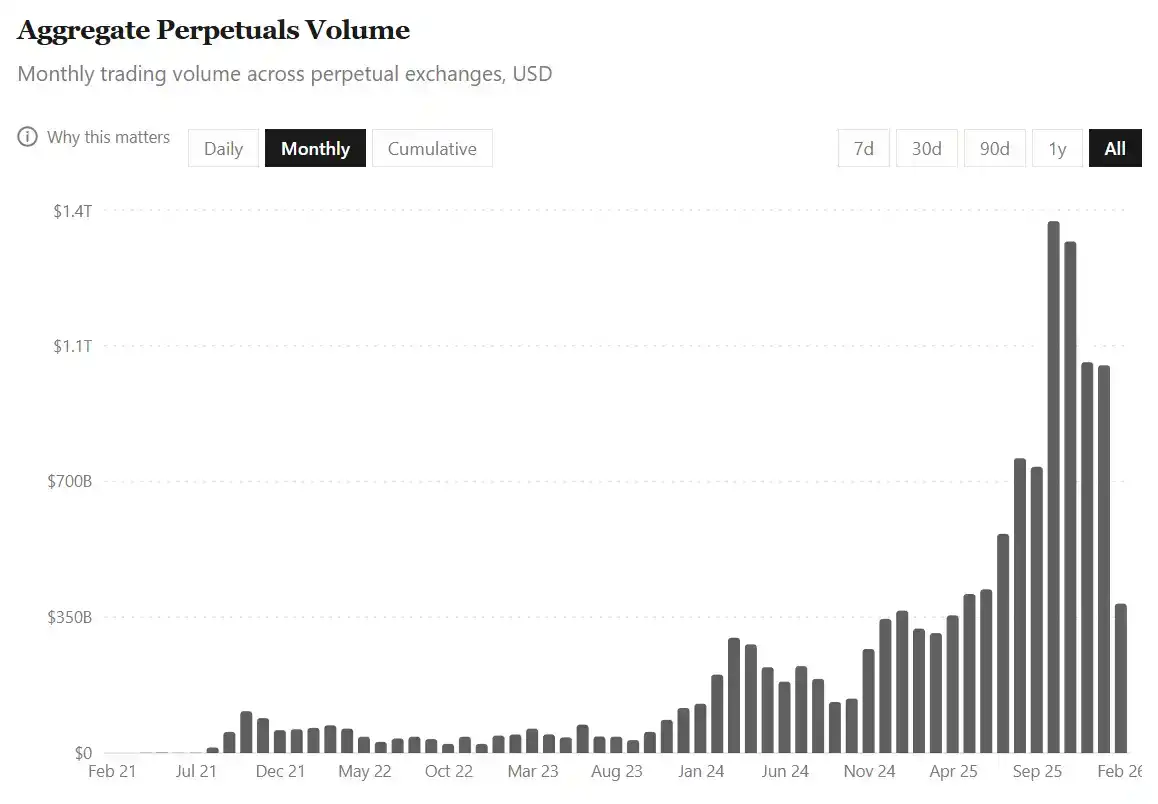
This growth has been particularly significant in the past few months:
· The cumulative total perpetual trading volume across all platforms over the four years ending July 31, 2025, was $6.91 trillion.
· In just the past six months, this volume has doubled, reaching $14 trillion.
All this growth occurred against the backdrop of the total crypto market capitalization shrinking by nearly 40% between August 1, 2025, and February 9, 2026. This activity indicates that traders are increasingly leaning towards derivative trading, hedging, and short-term positioning, especially when spot markets become highly volatile and bearish.
But there's a catch. With such massive activity, it's easy to misread volume metrics. Especially because perpetual trading isn't just about buying assets and holding them long-term; it also involves repeatedly adjusting bet sizes using leverage within shorter time frames.
Therefore, when market turnover accelerates rapidly, a question inevitably arises: Do record-breaking volumes reflect more capital inflows, or the same capital cycling faster?
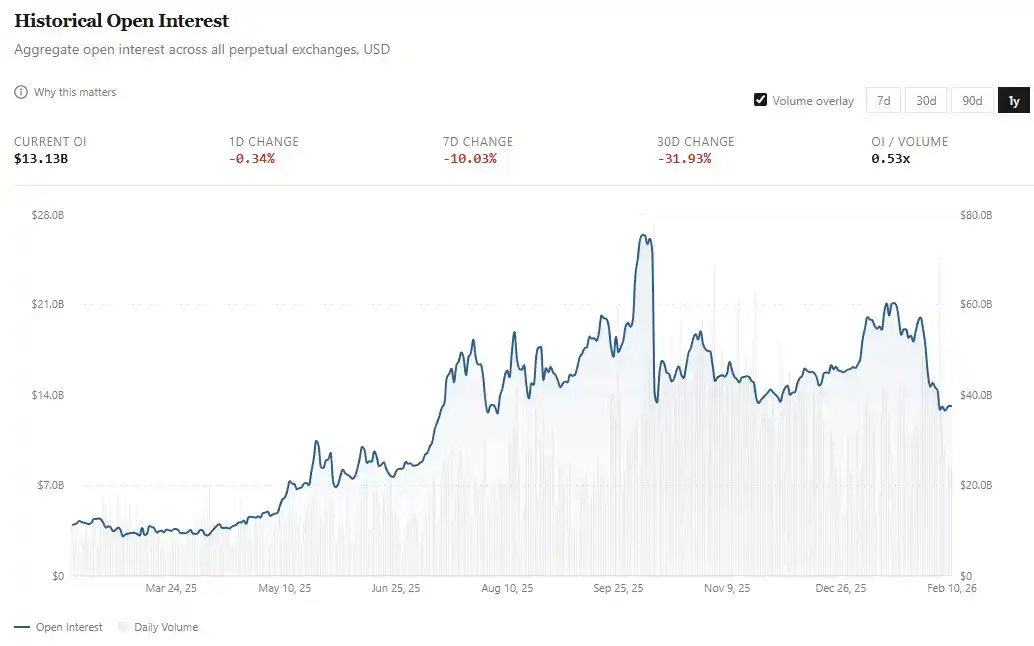
This is where observing Open Interest (OI) becomes meaningful. If volume reflects capital flow, then OI measures outstanding risk exposure. On perpetual exchanges, OI refers to the total dollar value of active, unsettled long and short contracts held by traders.
If perpetual trading is being adopted by the mass market, we would hope to see not only larger capital flows but also proportionally growing open interest.
· Last February, OI averaged around $4 billion;
· Now, that number has more than tripled to approximately $13 billion. In fact, the average for the entire January reached about $18 billion before dropping by about 30% in the first week of February.
While perpetual trading volume doubled over the past five months, OI grew by about 50% (from $13 billion to ~$18 billion, then back to $13 billion). To better understand this, I looked at the capital efficiency (i.e., OI as a percentage of daily volume) over the past year.
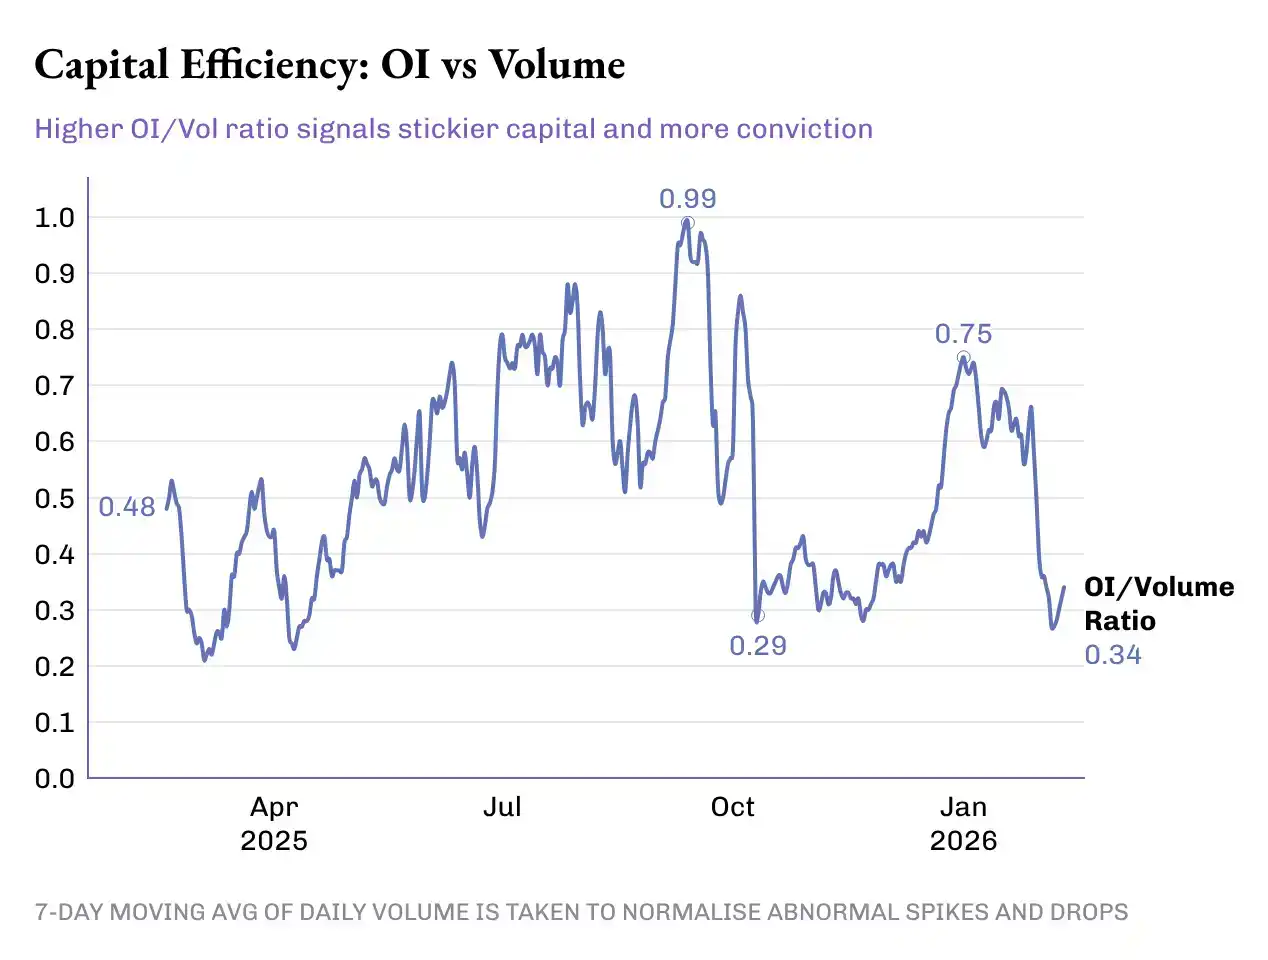
The OI/Volume ratio jumped 50% from last year's 0.33x to 0.49x today. But this progress wasn't smooth; the 50-basis-point increase in the ratio went through multiple peaks and troughs:
· Phase 1 (Feb - May 2025): The Dormant Period. The OI/Volume ratio averaged ~0.46x, with average OI of ~$4.8 billion and average daily volume of ~$11.5 billion.
· Phase 2 (June - Mid-Oct): The Leap. The ratio averaged ~0.72x. During this period, average OI rose to $14.8 billion, and average daily volume was $23 billion. This marked not only record-high volumes but also increased risk exposure and greater capital commitment to these derivatives.
· Phase 3: Market Reversal. This phase began with the massive liquidation on October 10th, which wiped out over $19 billion in leveraged positions within 24 hours. From mid-October to late December, the OI/Volume ratio fell to ~0.38x, driven primarily by volume growth while open interest largely stagnated. October, November, and December saw the three highest monthly volumes in 2025, averaging over $1.2 trillion per month. During the same period, OI averaged around $15 billion, slightly below the average of the previous three months.
Protocol Level
Here, I want to add more dimensions at the protocol level for perpetual markets. This helps us understand how efficiently perpetual exchanges convert trading activity into "sticky capital" and revenue.
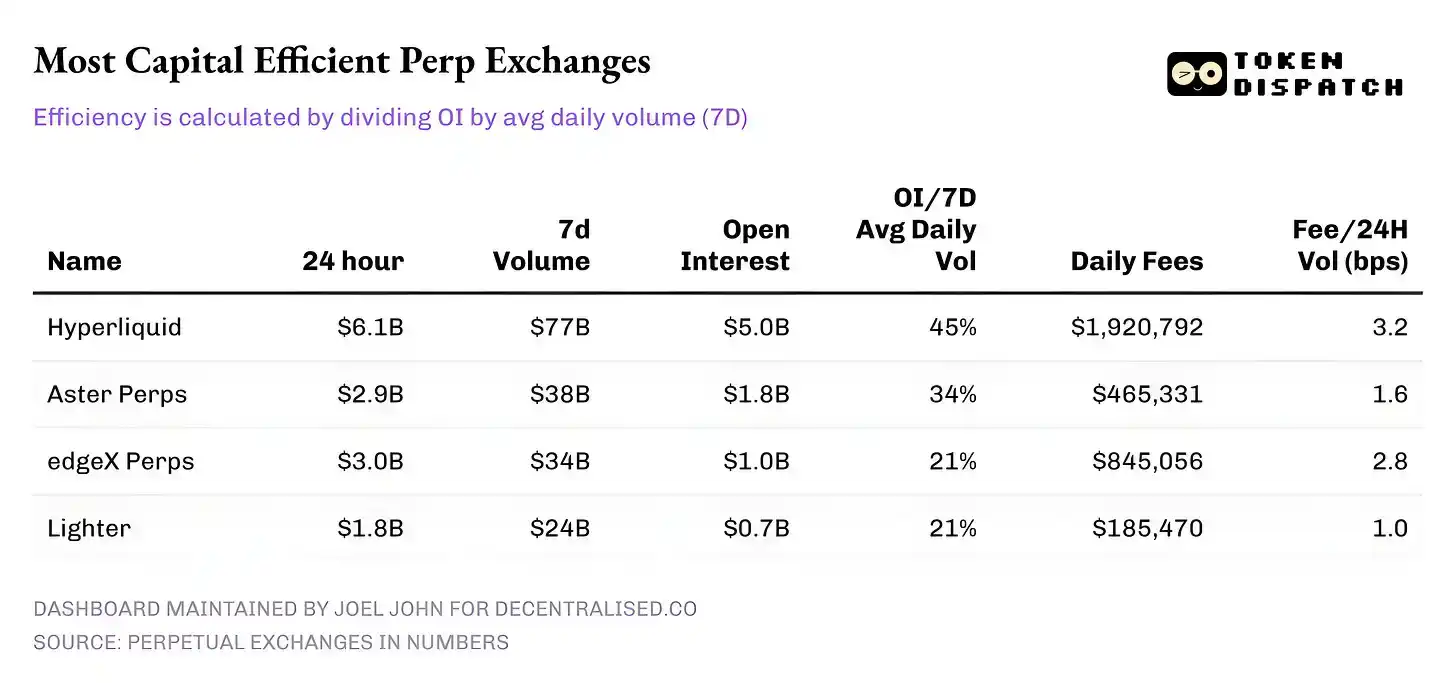
As of February 10th, here's how the top five perpetual exchanges by 24-hour volume performed:
· Hyperliquid: Its ratio of OI to 7-day average daily volume is over 45%, able to convert a large share of volume into lasting positions. This suggests that for every $10 traded on the platform, $4.50 is invested in active positions. This is important because a high OI ratio leads to tighter spreads, deeper liquidity, and confidence in scaling trades without slippage.
· Hyperliquid's fee revenue reinforces this story. Its take rate is about 3.2 basis points, converting the largest share of 24-hour volume into fee income.
· Aster: Currently ranked second, it maintains a decent capital efficiency (OI/Vol) of 34%, despite having almost half the volume of Hyperliquid. However, its monetization is noteworthy – with a lower take rate (~1.6 bps), Aster clearly prioritizes capital retention on its platform over fee maximization.
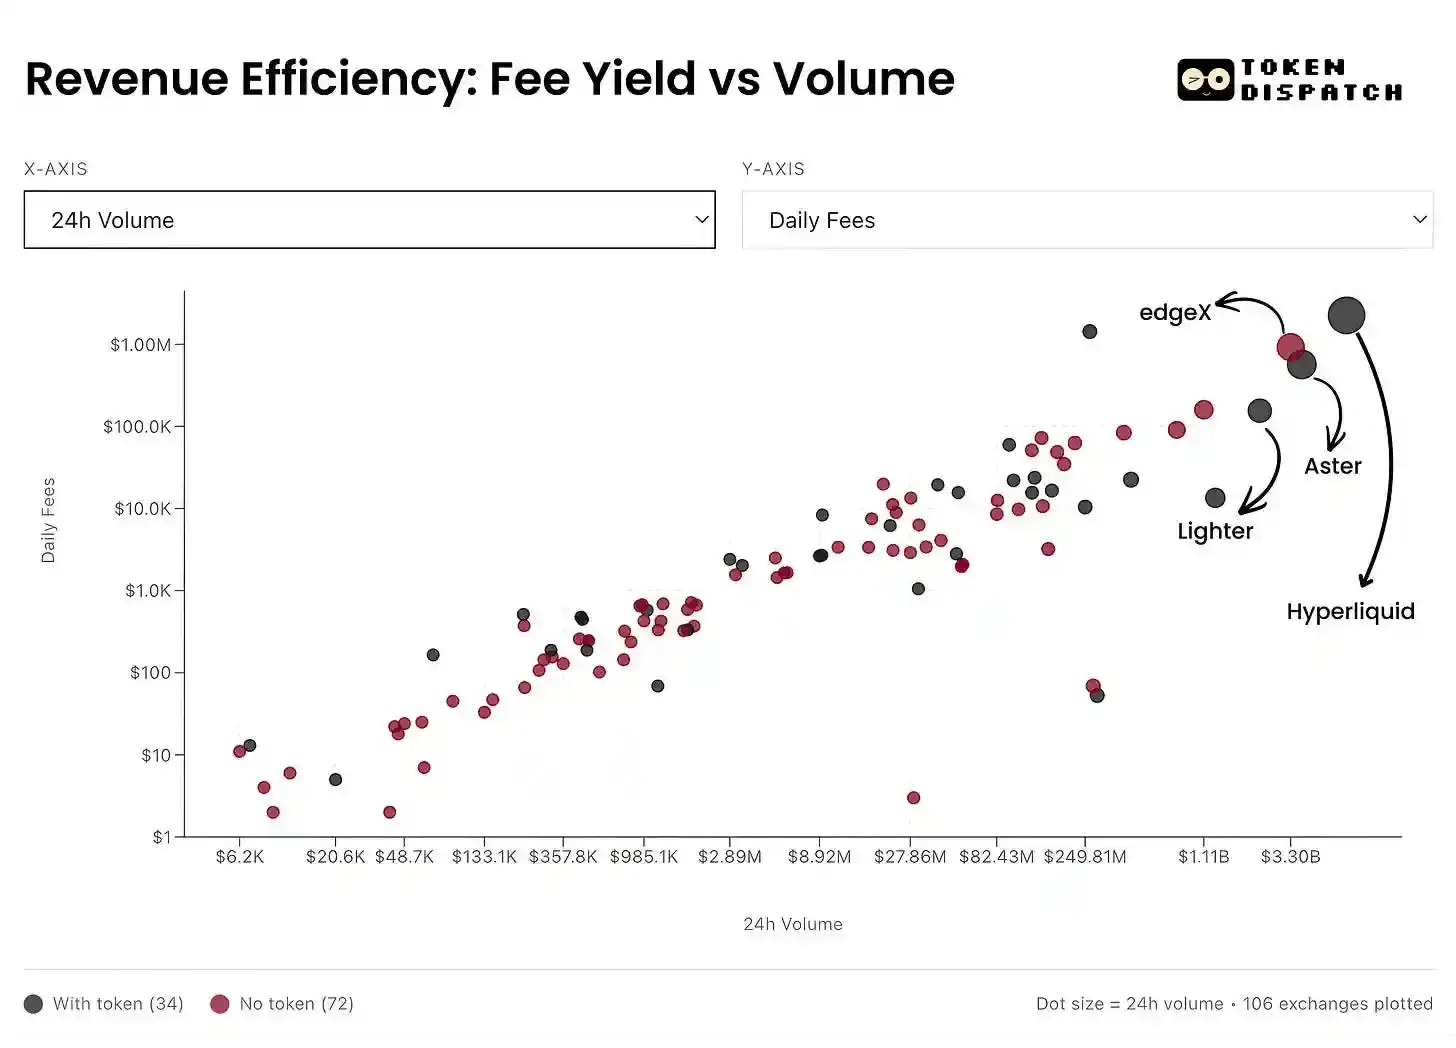
· edgeX and Lighter: Both perform similarly on the capital efficiency ladder, with an OI/Vol of 21% each. However, edgeX's fee monetization is comparable to Hyperliquid's, at 2.8 bps.
Summary
It's remarkable that today's perpetual contract market is no longer a simple growth story; it requires a nuanced reading of multiple metrics. At the macro level, volume is exploding: the growth in cumulative trading volume over six months exceeded the total of the previous four years. But the picture only becomes clear when OI and volume are read together.
A clearer victory lies in the growth of the OI/Volume ratio. This is a direct signal that "patient capital" is willing to trust and bet on the various products and markets emerging in perpetual exchanges.
What's more worth watching in the future is how individual players will evolve from here and what they choose to optimize. Over time, platforms that can optimize "trading conviction" and achieve sustainable monetization will be far more important than those that merely rely on rewards and incentives to dominate volume leaderboards.